




/Passle/MediaLibrary/Images/2026-01-09-17-39-30-998-69613d52d42b6e4a584155de.jpg)
The macroeconomic backdrop to private capital markets - July 2026
27 minute read
The last six months were characterised by a shift in central bank policy from accommodative to restrictive, divergence in economic performance across countries and sectors, and energy commodity price volatility resulting from the US-Iran and Russia-Ukraine conflicts.
Corporate deal volume was high and driven by large transactions. The public equity market was volatile but remains priced near all-time heights, absorbing several large initial offerings. Private capital fundraising was concentrated among large established managers with higher allocations from institutional investors and wealth funds, but with an exit market that remains muted.
For the remainder of the year, the market consensus is that central bank policy will remain restrictive, energy prices will normalise if the US-Iran conflict winds down, and there is potential for market volatility centred on the midterm elections in the US and the UK’s change of leadership. Corporate deal volume is expected to remain high and driven by large transactions, with several large IPOs and robust secondary offerings. Liquidity in the private market is expected to remain strong from other sponsors and alternative mechanisms including continuation vehicles. Given the shift in central bank policy, high competition, and an increase in defaults in certain segments, private capital returns are broadly expected to be flat or down.
In our Sector Spotlight, we discuss current developments in artificial intelligence (AI), data centres, and the UK Private Finance Initiative (PFI).
Macroeconomic update
Monetary policy
The key monetary policy developments since our last update are:
- a shift in central bank policy from accommodative to restrictive, as demonstrated by rate increases by the European Central Bank and Bank of Japan and revised forward guidance, and;
- the confirmation of Kevin Warsh as the new chair of the US Federal Reserve.
Warsh was appointed on 22 May 2026 and led his first Federal Open Market Committee (FOMC) meeting in the middle of June, in which the bank held its policy rate steady at 3.50–3.75%1. In the press conference after the meeting, Warsh emphasised that the committee will deliver price stability but noted pressure on inflation, output and employment trends2. The current market consensus is that rates will remain steady at the July policy meeting and remain steady or increase later this year, which is a shift from expectations at the time of our last publication, when a rate cut was still considered likely.
The US Federal Reserve has a dual mandate: price stability and maximum employment. Warsh has previously emphasised price stability but did voice support last year for rate cuts (when the economic outlook was different). Warsh is generally considered less in favour of providing guidance to markets, which might increase uncertainty regarding the course of monetary policy in the US. However, Warsh recently said at a banking conference3 that expectations of future inflation have gone down over recent weeks and that there should not be an expectation that the FOMC would tolerate inflation above its 2.0% target.
Warsh’s predecessor, Jerome Powell, has faced significant pressure from the US executive branch to lower policy rates to promote economic growth. It is unclear if monetary policy will become more expansionary under Warsh, considering his views on price stability. However, the appointment of Warsh has resolved uncertainty around monetary policy leadership, which is positive for markets. Powell will hold a seat on the FOMC until his term on the Board of Governors expires in January 2028.
In Europe, central bank policy and market expectations have also shifted to a more restrictive stance compared to the downward interest rate trend that was dominant at the start of this year.
On 11 June 2026, the European Central Bank (ECB), which unlike the Fed does not have a dual mandate, raised its policy rate by 25 bps to 2.25%4. This was the first rate increase in three years and reflects higher inflation expectations following inflation reports of 3.2% in May and a forecast above the bank’s 2.0% target for 2027. The rate increase was anticipated by the market. Rates are expected to remain steady or increase later this year, albeit inflation had declined to 2.8% in June. The market expects at least one more rate increase this year, with the first expected in September or October.
The president of the ECB, Christine Lagarde, has indicated that she might leave the ECB before her term expires in October 2027 which may create some institutional instability. European leaders are expected to formally start the process of selecting her successor in the second half of this year.
The Bank of Japan mirrored the rate increase by the ECB by increasing rates by 25 bps to 1.0% on 16 June 2026, the highest level in 31 years and the first increase since December 2025, mainly due to inflation pressure from high energy costs. In a statement accompanying the increase, the central bank noted that it would continue its normalisation process towards price stability defined as 2.0% inflation and indicated it may increase rates further and shrink its balance sheet.5
In the UK, the Bank of England (BoE) kept its policy rate steady at 3.75% in June 2026. The decision followed lower-than-expected inflation in May, which remained at the 2.8% recorded in April, and a 0.1% economic contraction in April following a 0.6% expansion in Q1 2026.6 Andrew Bailey, the Governor of the Bank of England, highlighted lower energy prices in the days before the policy decision and said the bank would temporarily tolerate above-target inflation but respond promptly if inflation would not normalise. The next BoE Monetary Policy Committee meeting will be held on 30 July.
In summary, current headline inflation is above the central bank target in both the US and Europe, which is broadly considered the result of one-off price shocks in the energy market and tariffs. Long-term inflation expectations remain relatively stable, but the impact of AI capital expenditures on demand for consumer and capital goods may keep inflation above target. Central banks were considered too slow in their response to an uptick in inflation in 2022, exacerbated the level and duration of inflation at the time, and will be keen to act if inflation does not normalise soon, even if economic conditions are not favourable to accommodate higher interest rates.
Economic developments and fiscal policy
Since our last update, there has been further divergence in economic performance across countries and sectors.
US
Growth has been moderate but resilient in the US, with gross domestic product (GDP) growth at 2.1% in Q1 2026 and forecast at 2.0% for the full year. Inflation was 3.5% in June and is expected to land at 3.7% for the full year and decrease to 2.1% in 20277,8. The US economy is supported by positive business and consumer sentiment, driven by AI and related capital expenditures, and has been less impacted by high energy prices as the US is a net energy exporter, unlike the UK and Euro area. Fiscal policy in the US remains very expansionary, with a budget deficit currently at approx. 5.8% of GDP9.
UK
Growth has been materially weaker in the UK and Euro area. The UK economy grew 0.6% in the first quarter, contracted 0.1% in April, and is forecast to grow 0.9% for the year. Inflation was 2.6% in June, below market consensus, and unemployment was 4.9% in April, forecast to increase to 5.5% by the end of 2026, and then decrease to 5.3% in 202710,11, 12. The UK economy is impacted by high energy prices. Fiscal policy remains expansionary, with a budget deficit of approx. 5.2% of GDP, and the fiscal outlook is uncertain given the change in prime minister discussed below13.
Europe
In the Euro area, GDP contracted by 0.2% in the first quarter of the year and is forecast to increase to 0.8% for the full year14. The Euro area saw stable private-sector activity and higher retail sales in June 2026, following a decline in both metrics in the prior month15,16. Inflation is at 2.8% in June and expected to decrease to 2.4% in 202717. Unemployment is at 6.2% in May and forecast at 6.3% next year. GDP readings in the Euro area can be volatile, in part due to swings in Irish GDP from large cross border financial flows from multinationals that operate in the country, and the impact of the US-Iran conflict on energy costs and stockpiling.
Funding costs in (public) debt markets have recently increased due to the reversal of central bank policy towards flat or higher policy rates, the geopolitical developments discussed below, and significant issue of government debt. Higher interest rates will translate into higher mortgage rates and make refinancing of corporate debt more difficult, which might slow down economic activity.
The expected structural economic benefits from AI, such as higher productivity, have not yet materialised as AI adoption is still at an early stage. However, the economy has seen significant support from high capital expenditures, valuations and positive market sentiment. Profit margins have consistently increased over the last two years, which could be due to higher productivity, but a causal relationship with AI has not (yet) been established18. AI adoption is forecast to increase significantly, with a 24-fold increase in token consumption by 203019. Chip shortages and supply chain constraints are expected to remain prominent over the next 12 to 18 months.
Figure 1: Summary of macroeconomic indicators
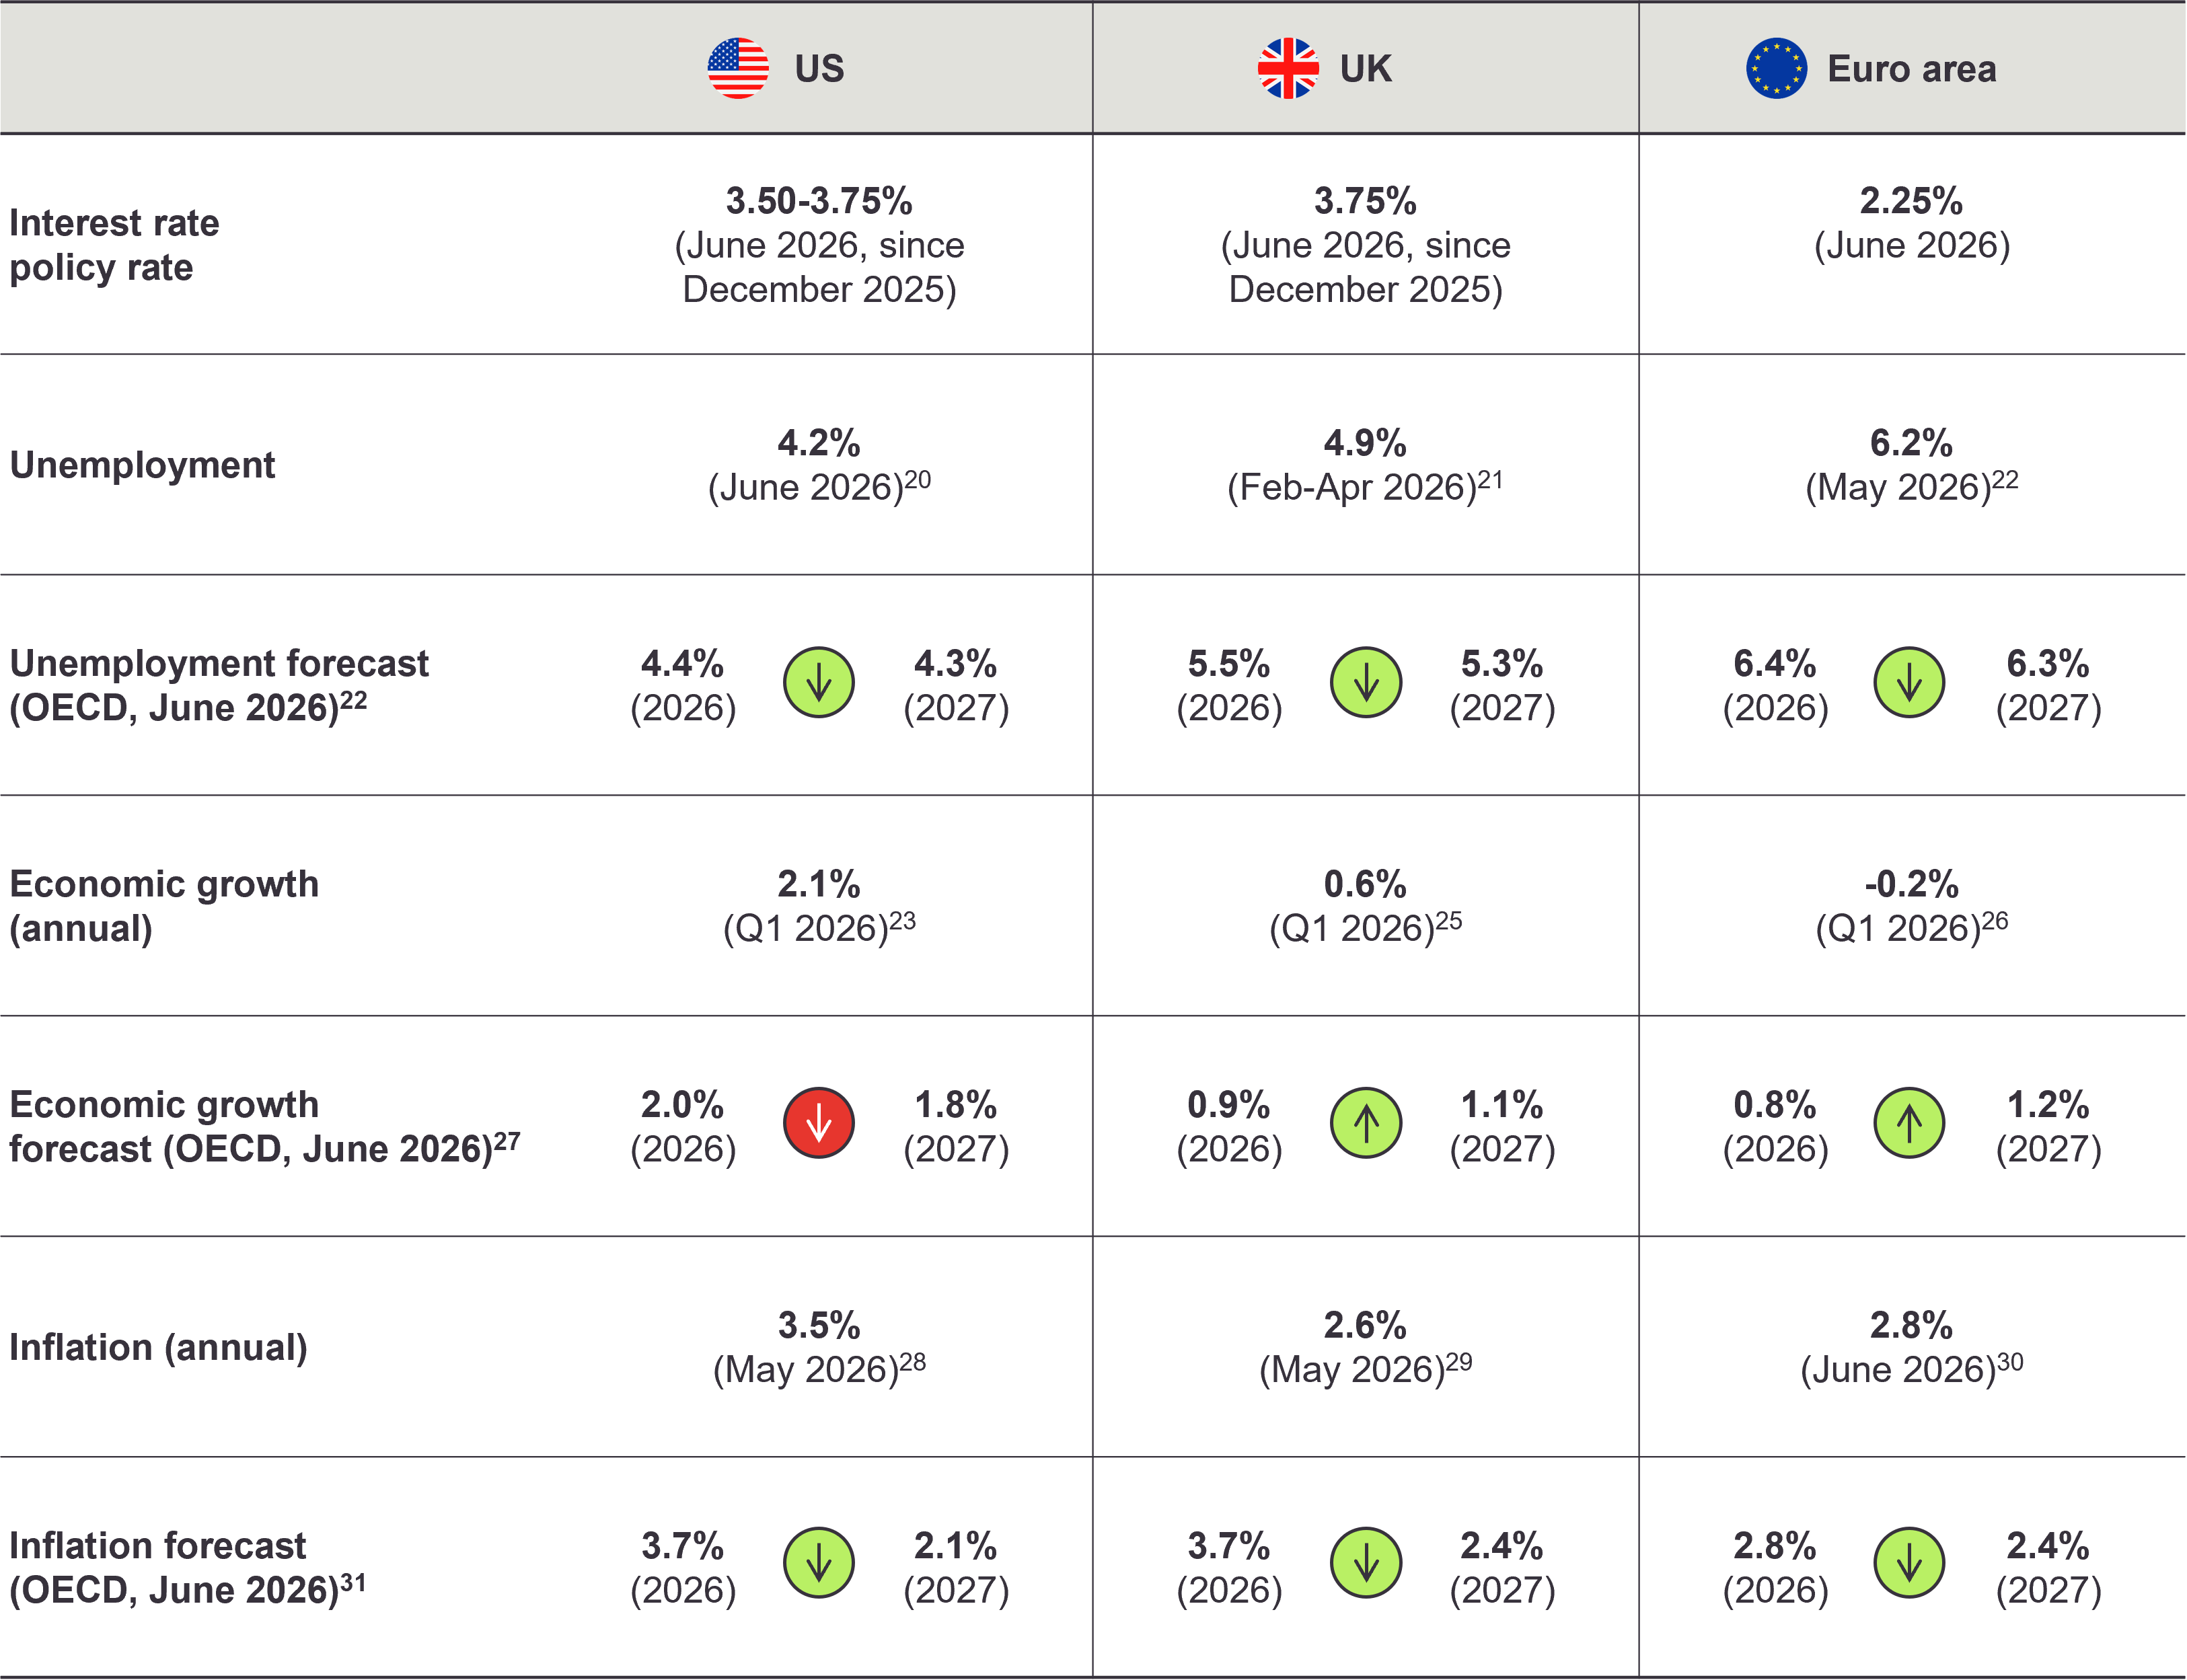
Source: US Department of Labor, US Department of Commerce, US Federal Reserve, Bank of England, UK Office for National Statistics, European Central Bank, Eurostat, OECD
Geopolitical and regulatory developments
The November 2026 midterm elections in the US could have significant political and economic implications. The current US presidency has been quite favourable towards AI and the cryptocurrency sector and governs with majority control in both houses of Congress. Loss of majority or a smaller margin of control could result in less cooperation and possibly an adversarial relationship between the executive and legislative branch, as happened at the end of the first term of the Trump presidency, at the time resulting in a government shutdown and less effective governing.
Loss of legislative control could further result in an increase in oversight and regulation of financial markets and impact the product and funding markets for firms with exposure to AI, which we discuss further below. Potential economic implications could be significant given the level of capital expenditures associated with AI.
In the UK, Prime Minister Keir Starmer resigned on 22 June 2026 following a period of intense pressure surrounding his leadership. Andy Burnham became the new prime minister on 20 July and may adopt more populist or left-leaning policies. Any change to fiscal policy and discipline will be tested by the bond market, resulting in possible volatility and higher yields until changes to policy become clear32. The Labour Party governs with a strong majority in the House of Commons; the next general election must be held before 15 August 2029.
The current major geopolitical development impacting commodity markets is the conflict between the US and Iran. Since its start in February, the conflict has contributed to energy and capital market volatility as Iran restricted access to the Strait of Hormuz, a key shipping passage with a daily flow of c. 20m barrels of crude oil, representing c. 25% of seaborne oil trade and c. 20% of liquified natural gas. This resulted in high oil and natural gas prices but seems to have had limited impact on long-term inflation expectations or the economy outside the region. Europe and Asia have been hit harder than the US, which benefits from higher energy export prices, greater energy independence, and other structural factors supporting its economy.
Following the US-Iran Memorandum of Understanding, signed on 17 June 2026, oil prices initially normalised to levels before the conflict started, but the conflict has reignited in July resulting in higher and volatile oil prices. Once the conflict ends and the Strait reopens, it would take several months for oil trade and supply to normalise. The Russia-Ukraine conflict remains ongoing and mainly impacts European energy markets.
In terms of regulatory developments, we note an increase in scrutiny of private capital markets by regulators.
The Bank of England’s system-wide exploratory scenario (SWES) exercise on private capital is ongoing. In its latest review of the UK’s financial stability the Bank reported vulnerabilities in private credit but did not offer any firm conclusions or recommendations. The exercise is focused on systemic risk due to the increased complexity and interconnectedness of private credit within the wider economy and capital markets. We discuss this exercise in more detail in a recent article. The Financial Stability Board has published a report exploring similar risk, including the exposure of private credit to AI companies33.
The Australian Securities and Investments Commission (ASIC) released the results of an industry survey on private credit and issued a notice calling managers to ensure that their 30 June 2026 asset valuations are “current, accurate and grounded in realistic assumptions”34. This follows publication in November 2025 of 10 principles that managers should follow on transparency, governance and valuations. Along with other global supervisory bodies, practices in private credit will continue to be an enforcement priority for the ASIC and others in 2026 and beyond.
Since our last update, AIFMD II, an update to the AIFMD regime, has come into effect, introducing stricter regulatory and operational standards for fund managers. We explore the implications for fund managers in a recent insight podcast.
On 19 June, the Bank of England’s Prudential Regulation Authority published a consultation paper on the Basel 3.1 market risk framework, proposing certain adjustments to capital requirements and monitoring periods that could reduce compliance and operational costs for banks once the framework is implemented on 1 January 2028. These changes would make banks more competitive when originating and pricing (private) credit relative to other capital providers.
Developments in private markets
Assets under management (AuM) in private capital markets are expected to continue to grow at a faster pace than AuM in more liquid markets, at respectively 12.0% and 8.0% per year over the next five years35. However, in Q1 2026, fundraising by private equity sponsors fell for the eighth consecutive quarter to $373bn across 549 funds, the lowest since Q1 201736. In private credit, direct lending issuance slowed down in Q2 2026, with fundraising concentrated among large established managers who raised several large funds including in Europe. Business development companies in the US raised $500m in May 2026, the lowest fundraise in 18 months37,38.
We observe an increase in alternative funding mechanisms, including NAV-based financing, which we discuss further in a recent article.
Weak cash distributions to investors has made fundraising for smaller or less established funds more difficult39. The average holding period of a portfolio company has increased to more than six years, up from five in 202040. The period after COVID was characterised by high acquisition multiples and low interest rates, and frequently involved sectors such as software which are now disrupted by AI, with managers hesitant to crystallise limited returns on capital.
Global private equity deal volume was at 4,168 transactions valued at $436bn in Q1 2026, which is a decrease from a strong second half of 2025, but still considered robust. In terms of deal composition in Europe, megadeals accounted for 37.7% of private equity deal value, club deals for 43.3%, and add-ons for 71.4% of all buyouts41. Global “dry powder” available for deployment remains above $2tn.
Private equity realisations in Q1 2026 were below prior quarters, with 635 transactions valued at $294bn42. In Europe, liquidity is mainly coming from other sponsors and megadeals, accounting for 76.1% and 67.9% of deal value in Q1 2026, respectively43. We have seen an increase in the use of continuation vehicles due to constrained exit markets, and we expect this trend to continue. The secondaries market is forecast to grow significantly in the coming years44. In addition, the positive sentiment in the public equity market discussed below suggests that public offerings could become more attractive to provide liquidity.
Weaker realisations have resulted in reports of individual managers more frequently using carried interest entitlements as collateral when seeking liquidity through borrowing45.
A major development that has continued since our last review, with significant press coverage, is volatility in evergreen vehicles with exposure to private credit. Funds in this space, predominantly in the US, continue to experience high redemption requests, often in excess of redemption caps46. Price volatility appears often tied to uncertainty around the quality of the portfolio and whether the fund’s valuation practices are sound, allocations to sectors disrupted by AI, and the upcoming refinancing of debt raised at low interest rates in the period following COVID. These have mainly been concerns in the US, less so in the UK and Europe. We explore these developments further in a recent article on valuation in private credit.
Within private credit, 93% of fund managers expect flat or lower returns this year, mainly due to competition (spread compression), borrower defaults and macroeconomic trends. Total capital allocated to private credit is still forecast to increase47.
The number of non-performing loans has increased in recent months, with the overall private credit default rate in the US at 6.0% in May, which is unchanged from April, but higher than in recent years48. This default definition includes maturity extensions, introduction of payment-in-kind (PIK) interest in lieu of cash, and uncured defaults. The use of PIK arrangements has increased since prior years49. In the US, defaults are concentrated in companies with EBITDA of less than $25m, with a default rate of 11.5% in May. For mid-market borrowers with an EBITDA of $26m to $60m, the default rate was 3.9% in May, down from the prior month.
In 2026, sovereign wealth funds increased exposure to private assets, with private equity allocations up from 7.1% in 2025 to 7.4% this year, real estate from 7.3% to 7.6%, and infrastructure from 8.1% to 9.0%50. Fixed income, which includes public and private credit, remained steady at 29.0%. The net allocation intention, representing the expected change in allocation over the next year, was surveyed at +35.0% for infrastructure and +28.0% for private equity and private credit. An increase in correlation between public equity and debt markets in recent years has resulted in wealth funds lowering exposure to public debt and increasing exposure to private assets.
Developments in public markets
Since our update in February, pricing in the public equity market has been volatile but strong, with the broader market currently trading near all-time highs with significant funding and deal volume. Between the start of February and 22 July 2026, the S&P 500 is up by 8.1%, the FTSE 100 by 4.8% and the Euro STOXX 50 by 6.2%.
Positive outliers are the technology-heavy NASDAQ Composite, up by 9.5%, and the Nikkei 225, up by 24.0%. The increase in the NASDAQ Composite is driven by investors increasing exposure to AI and related sectors, and strong earnings growth and margins in the technology sector51. The Nikkei 225 is up due to positive investor sentiment explained by the Bank of Japan having gained control over inflation, the government’s corporate reforms which include fewer complex cross-shareholdings, solid domestic demand, and high-quality technology assets with exposure to AI52.
In H1 2026, public and private announced M&A deal value was $2.9tn, an approximately 48% increase compared to the previous year and the highest level on record. The number of deals announced decreased by 9%, a six year low, as deal volume was concentrated in large transactions, with over $1.3tn in value coming from transactions in excess of $10bn53,54. Deal value was driven by the US, which recorded an 80% year-over-year increase to $1.6tn and Europe at $681bn, up 90% over last year, but with Asia (excluding Japan) down by 9% to $312bn55. The technology sector led with $649bn in deal volume and there has been record volume in the power and utility sector, driven by AI56. Within technology and the US, a single transaction, SpaceX’s $250bn acquisition of xAi, contributed a significant portion of volume.
For the full year, M&A volume is expected to reach a multi-year high in the US, driven by AI and related sectors such as power generation, and an increase in the sale of portfolio companies by private equity firms57. Large transactions typically lead the rest of the market. However, overall deal volume is forecast to continue to track below prior quarters58.
Investor appetite and positive market dynamics have resulted in several large IPOs in the first half of the year, including SpaceX and Cerebras. These offerings validated private market pricing, with each IPO reportedly priced above the most recent private funding round. On the day of IPO, Cerebras closed at $311 per share, up 68.1% from its $185 IPO price; SpaceX closed at $161 per share on the day of IPO, up 19.2% from its IPO price. Since then, both stocks have traded down, with Cerebras up 13.4% since IPO and SpaceX 14.6% below its IPO price, measured as of 22 July.
Global IPO volume was $207bn in H1 2026, the highest level since 2021, with approximately two-fifths coming from the SpaceX offering59. Initial offerings were concentrated geographically in the US with approx. $155bn of deal value (approx. 75% of funds raised), leading Europe which contributed $13.3bn in deal value and Asia. Deal volume was concentrated in the technology sector which accounted for 30-40% of deal volume, depending on how SpaceX is classified. US special purpose acquisition vehicle (SPAC) issuance increased from $13.3bn in H1 2025 to $22.7bn in H1 2026.
Several major IPOs are expected in the second half of the year, concentrated in the AI and fintech space. Anthropic has filed confidential IPO paperwork in June and the IPO of OpenAI is expected late in 2026 or in 2027. In fintech, IPOs are expected for Revolut and Stripe.
Secondary public offerings were at $370bn globally in H1 2026, an increase of approximately 37% over H1 202560.
Hyperscalers (large cloud providers) and AI firms have been a significant source of funding demand and are expected to remain so in the second half of the year. Several firms, including Alphabet, have turned cash flow negative for the first time since IPO and raised debt and equity capital to fund significant infrastructure and research & development costs. The net cash flow from these activities is still negative due to developing product market and intense competition to capture market share. Some of the funds invested in infrastructure and chips are recycled back into AI labs, which poses questions around valuation. We cover the AI and data centre sectors in more detail in our Sector Spotlight below.
The public debt market has also seen significant activity. In the period to June, companies in the US raised more than $50bn in convertible debt, which is the highest issue over the last 30 years, often at attractive terms including zero coupon rates and high conversion prices61. The expectation is that this trend will continue. Non-convertible debt has also seen significant issue.
The increase in funding costs in some segments of the public debt market, mainly due to higher base rates, while equity markets are trading at all-time highs can be considered unusual. The Wall Street Journal reported on a study that suggests that the premium paid for equity over debt is currently close to nil62.
Sector Spotlight
AI
Artificial intelligence (AI) has become the dominant force shaping capital allocation across private markets in 2026. At its core, AI refers to technologies capable of performing tasks that previously required human intelligence, from recognising patterns in data to generating text, images and code. The current wave is driven by large language models and generative AI, which have moved rapidly into commercial deployment across industries63. Experts note that AI is relevant to private capital at every stage of the investment cycle, as a direct investment target, a driver of value creation in portfolio companies, and a tool reshaping how GPs source deals, conduct diligence and manage assets64.
The two largest AI transactions in H1 2026 were the xAI/SpaceX merger ($250bn) and OpenAI’s funding round ($122bn). Of the 2,911 deals recorded in H1 2026, 1,828 had a disclosed deal size65. Excluding the xAI/SpaceX merger and OpenAI's funding round, those transactions totalled approximately $114bn in aggregate, a figure that illustrates how top-heavy the value distribution has become66. Large allocators are increasingly concerned about concentration risk in US platform valuations and are thus beginning to show a preference for non-US markets, smaller companies and overlooked sectors67.
Figure 2 - Selected data centre and compute infrastructure deals, H1 2026

Source: Preqin, 1 January–18 June 2026. Excludes xAI ($250bn merger) and OpenAI ($122bn).
Figure 3 - AI investment by segment, H1 2026
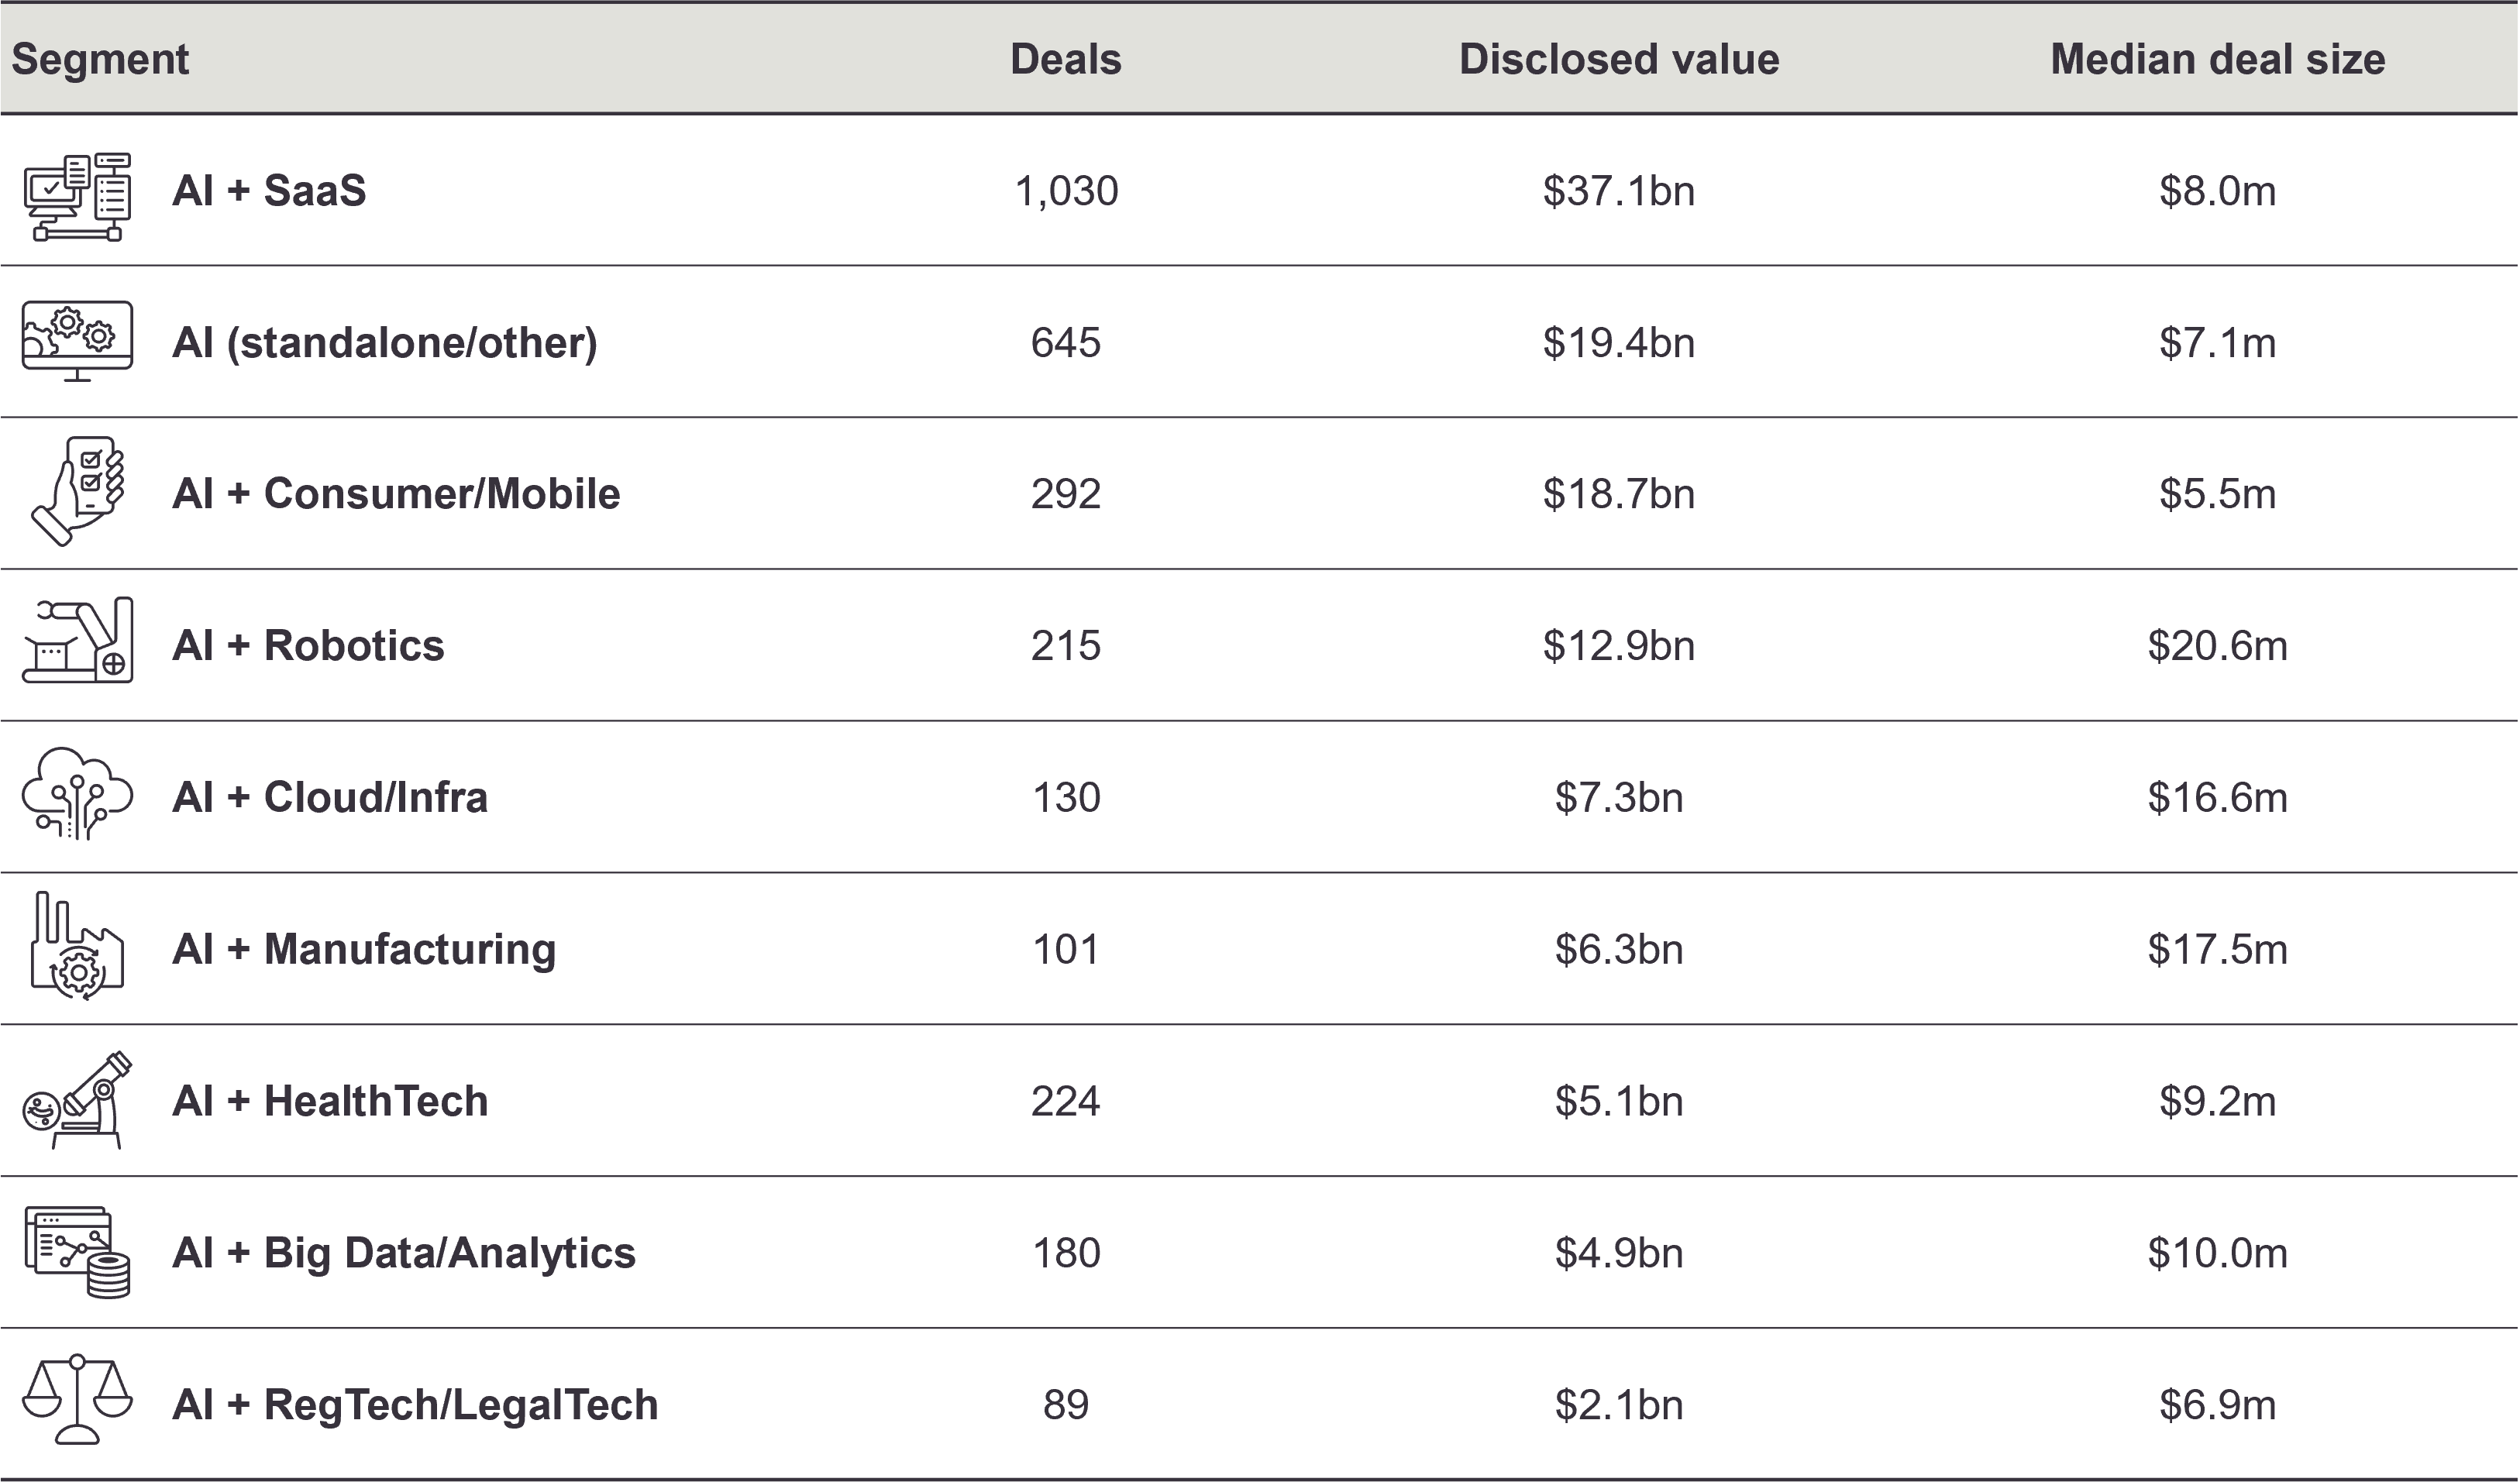
Source: Preqin, 1 January–18 June 2026. Excludes xAI ($250bn merger) and OpenAI ($122bn).
Although AI+SaaS led by volume in our dataset, the more instructive signal was median deal size. AI+Robotics, AI+Manufacturing, and AI+Cloud/Infra all sit materially above the SaaS median, reflecting heavier capital requirements in physical and infrastructure-adjacent applications.
With respect to regional distribution, although the US leads on volume and aggregate value, 60.4% of AI deals targeted companies outside the US, consistent with the concentration concerns raised by many industry experts68. China ranked second with a higher median deal size ($27.9m vs the US’s $15.0m), reflecting a market concentrated in larger rounds into scaled platforms. The UK is the clear European leader at 175 deals and $5.3bn in disclosed value, with notable transactions like Nscale AS’s $2bn Series C, CuspAI ($400m) and PhysicsX ($300m).
Figure 4 - AI investment by geography, H1 2026
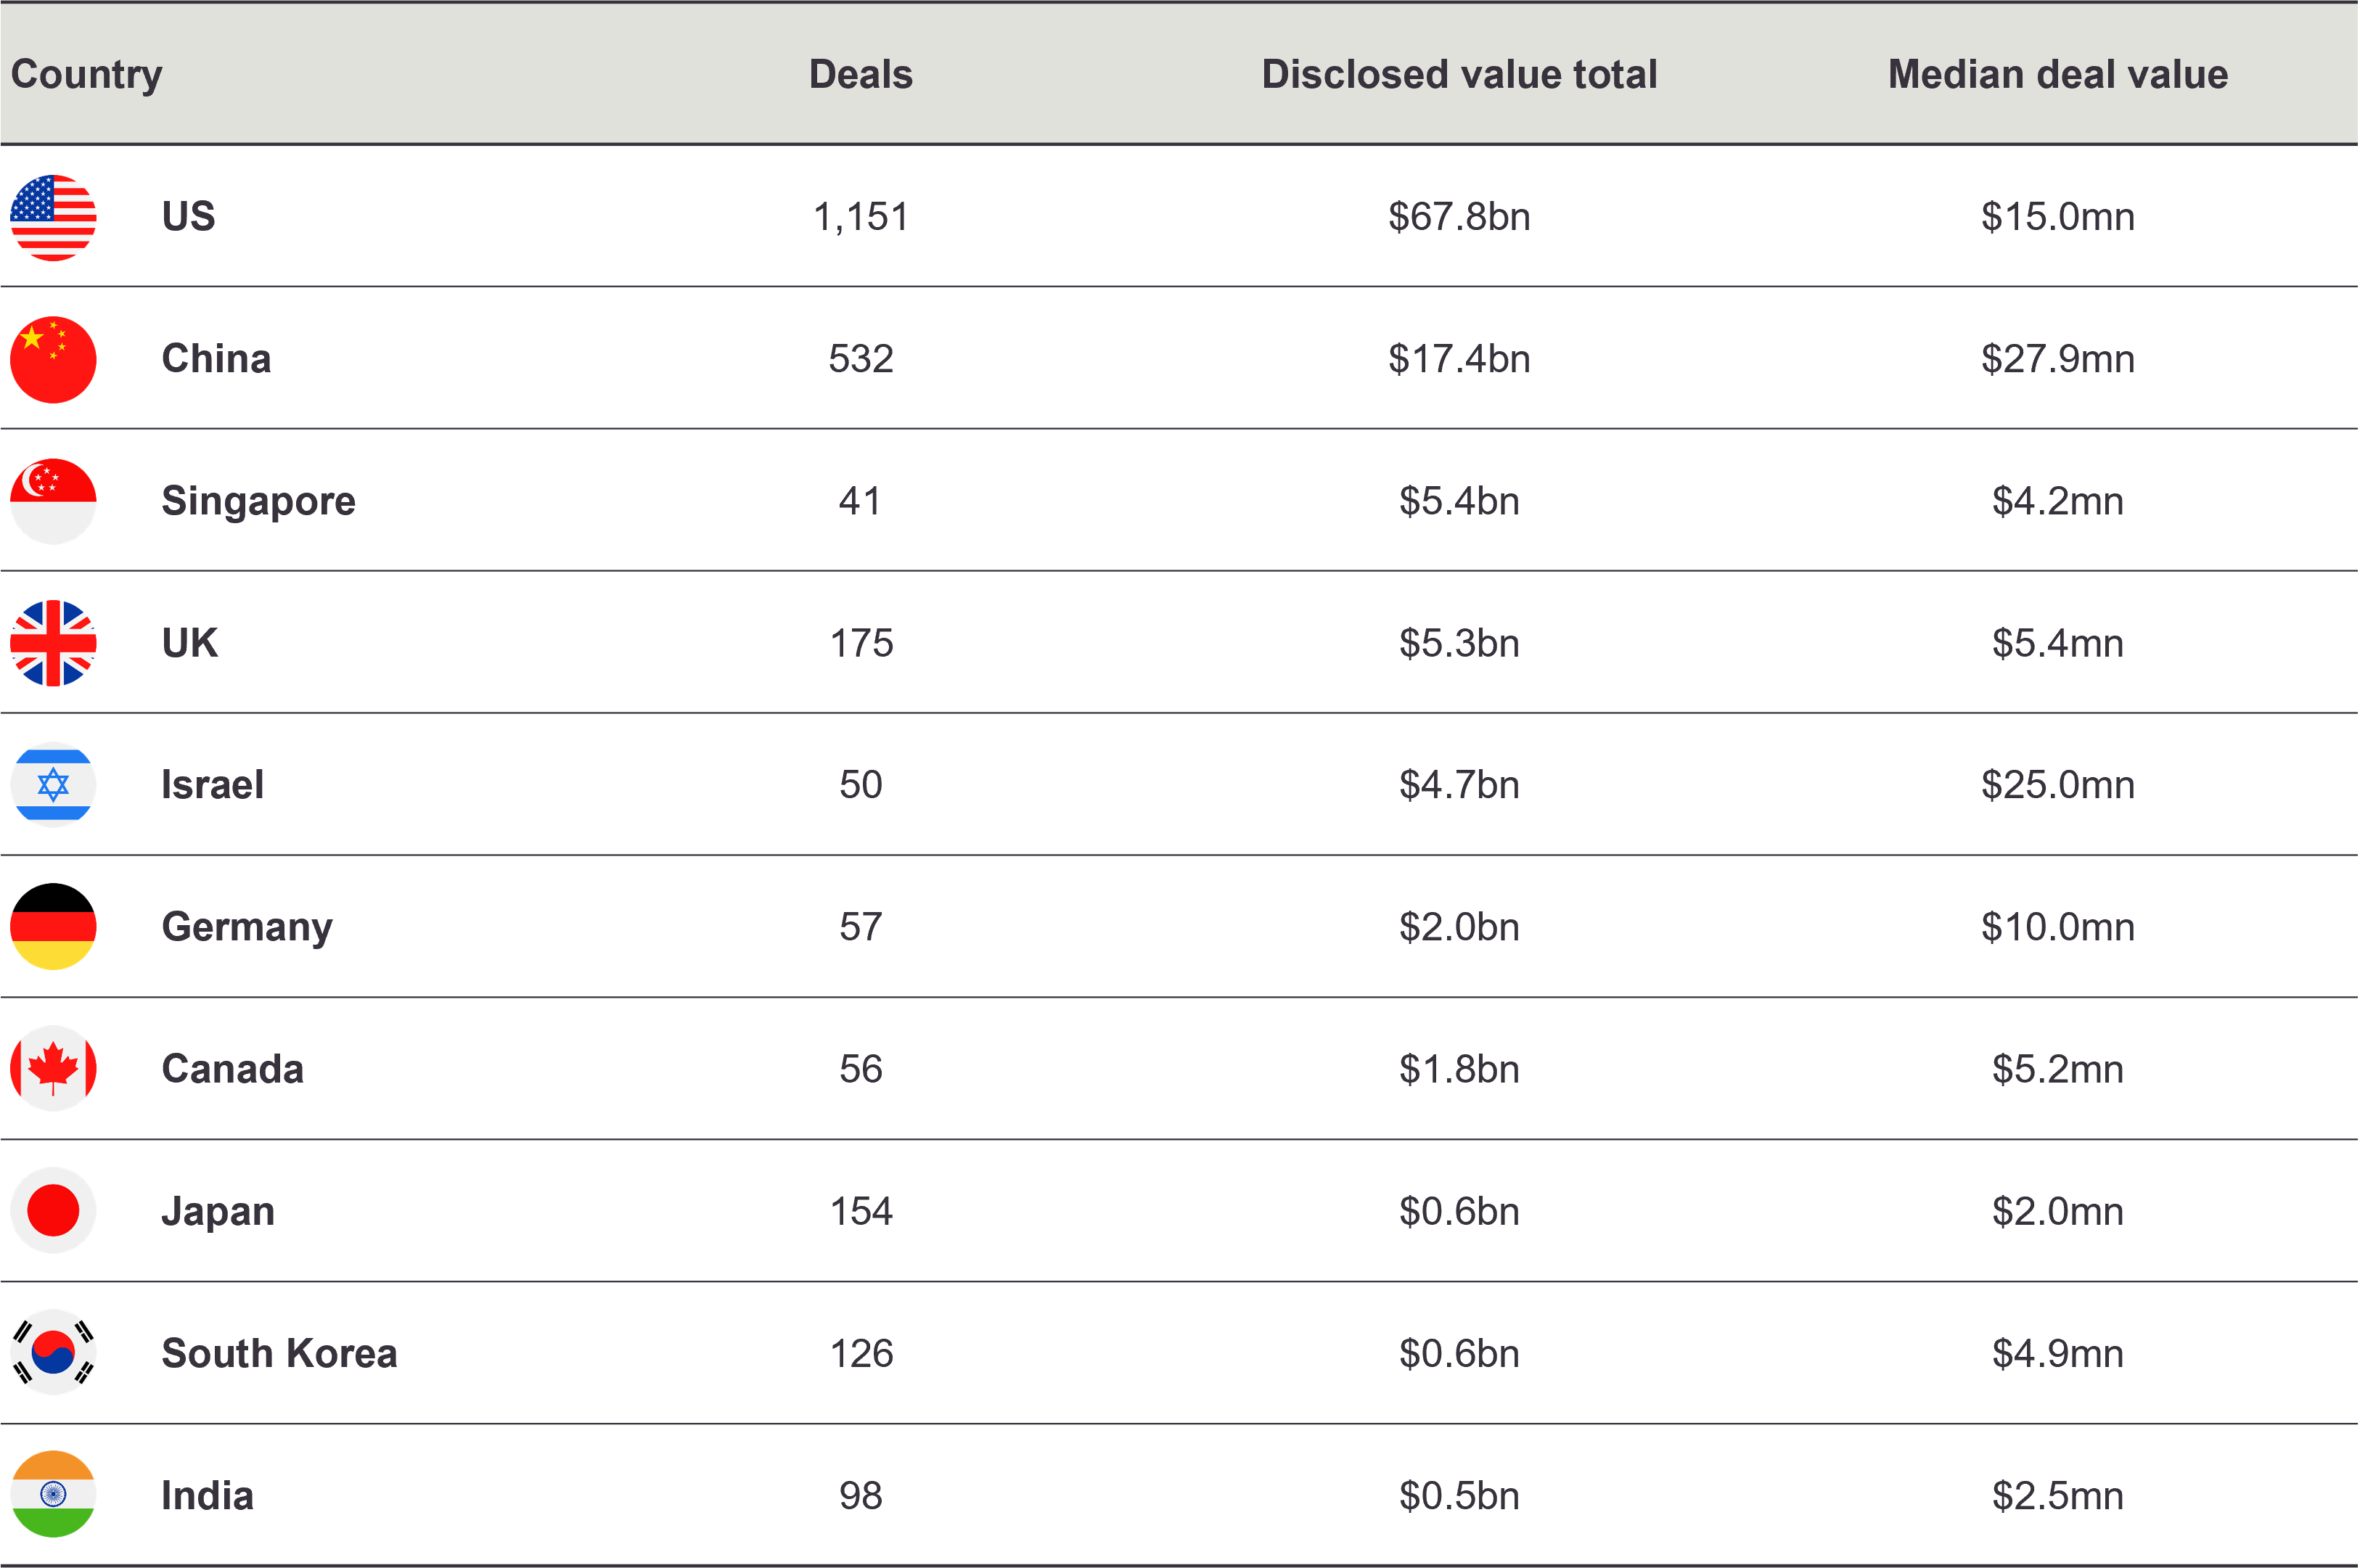
Figure 5 - Percentage share of AI deals by geography, H1 2026
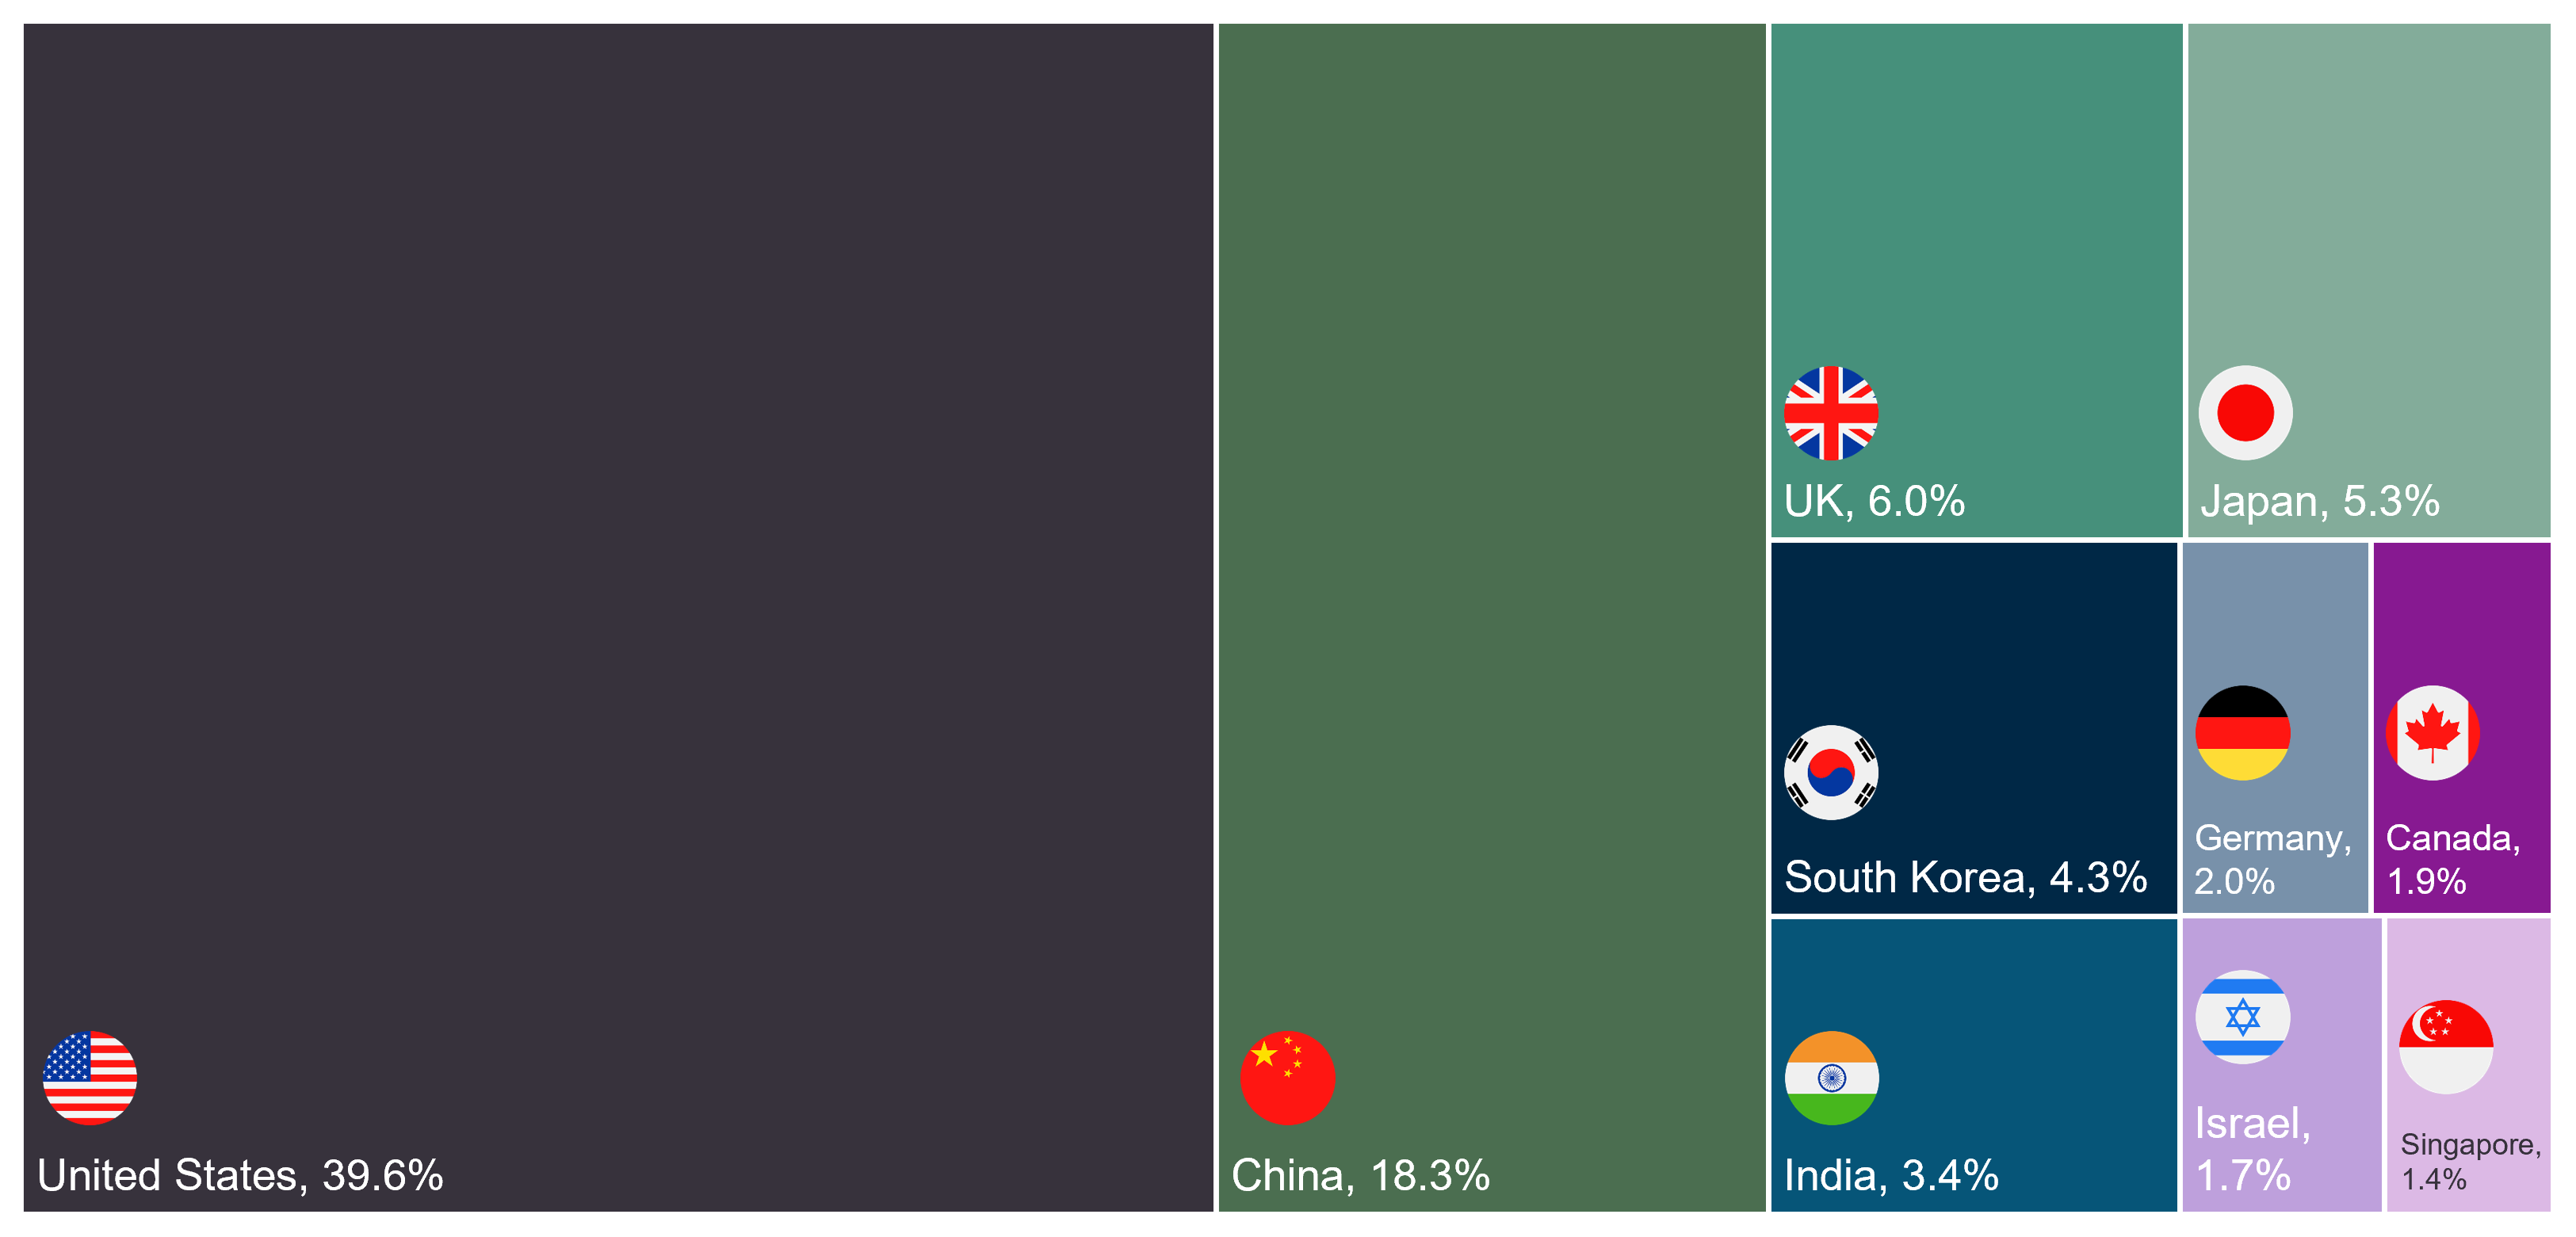
Source: Preqin, 1 January–18 June 2026. Excludes xAI ($250bn merger) and OpenAI ($122bn). Top 10 by deal count.
Within portfolio companies, AI has become more widely adopted. Experts note an estimated 70% of AI success depends on data engineering and change management rather than the technology itself, with $1 invested in AI transformation reportedly returning 2x to 5x within two years69. PE funds are increasingly deploying specialist AI units across their portfolios, with implementation shifting from cost reduction to cycle time acceleration and process transformation70. An Accordion survey found that 83% of sponsors wanted portfolio CFOs to invest in AI for value creation during the current period of uncertainty, while 74% of CFOs believed sponsors would prefer them not to71. Such communications gaps can impede mid-market firms seeking to become more competitive.
At exit, AI integration is also becoming a key differentiator for mid-market portfolio companies. Experts suggest that failing to embed AI will create a £5m valuation gap within 18 to 24 months, with buyers asking how deeply AI is integrated, not whether a business has experimented with it. Governance is also seen as a growing risk as many businesses have allowed decentralised AI adoption without policies, training or data controls, potentially creating compliance exposures that can surface during diligence72.
Data centres
Data centres are the physical infrastructure underpinning the AI economy, from the facilities housing the servers to storage systems and networking equipment required to train AI models and run AI-powered applications at scale. A single large language model training run can consume as much electricity as 100 average American homes in a year73. Analysts estimate that global digital infrastructure investment needs will reach $19tn by 2040, with data centre demand projected to more than triple by 203074.
Deal flow in H1 2026 reflects the pace and scale of this capital movement. We identified 136 transactions as data centre or compute infrastructure-related in the period, with $21.3bn in disclosed deal value across 94 transactions and a median deal size of $20m. The US led by deal count with 65 transactions and $11bn disclosed, whilst the UK ranks third in value terms at $4bn across 9 deals75.
Figure 6 - Selected data centre and compute infrastructure deals, H1 2026
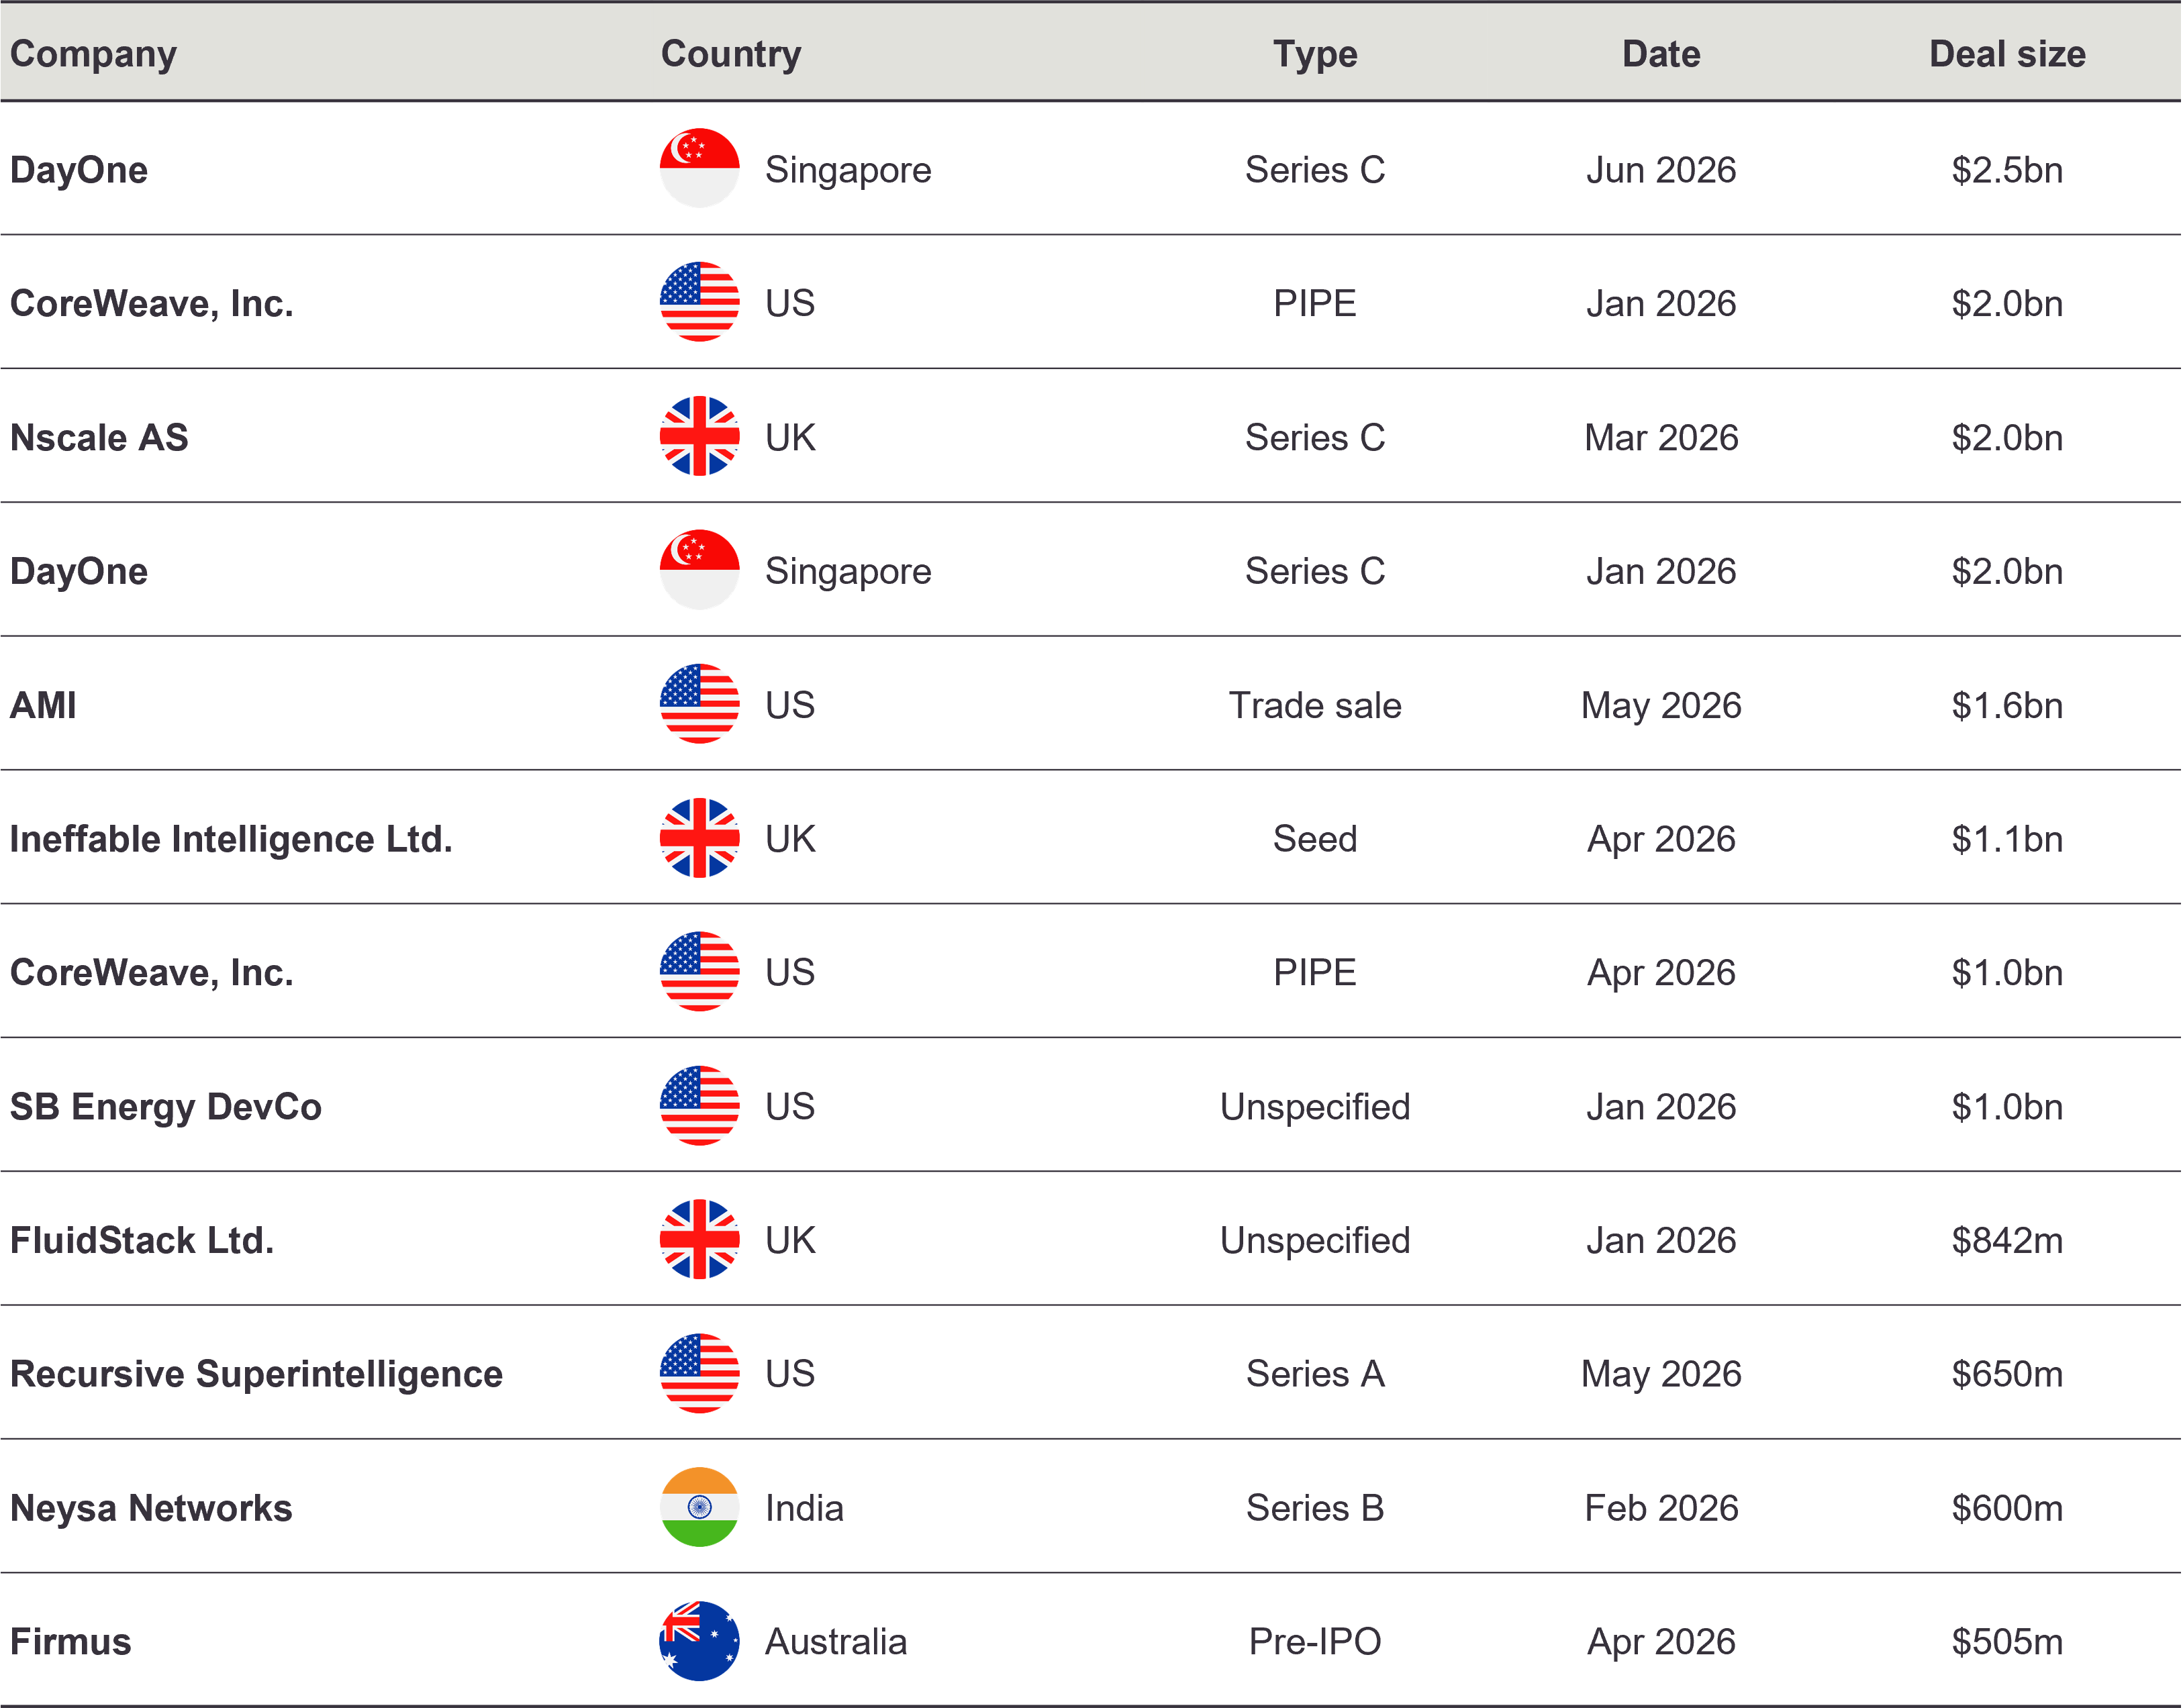
Source: Preqin, 1 January–18 June 2026. Singapore median reflects DayOne’s two Series C rounds ($2.0bn and $2.5bn). Total value reflects disclosed transactions only.
Figure 7 - Data centre deal flow by geography, H1 2026
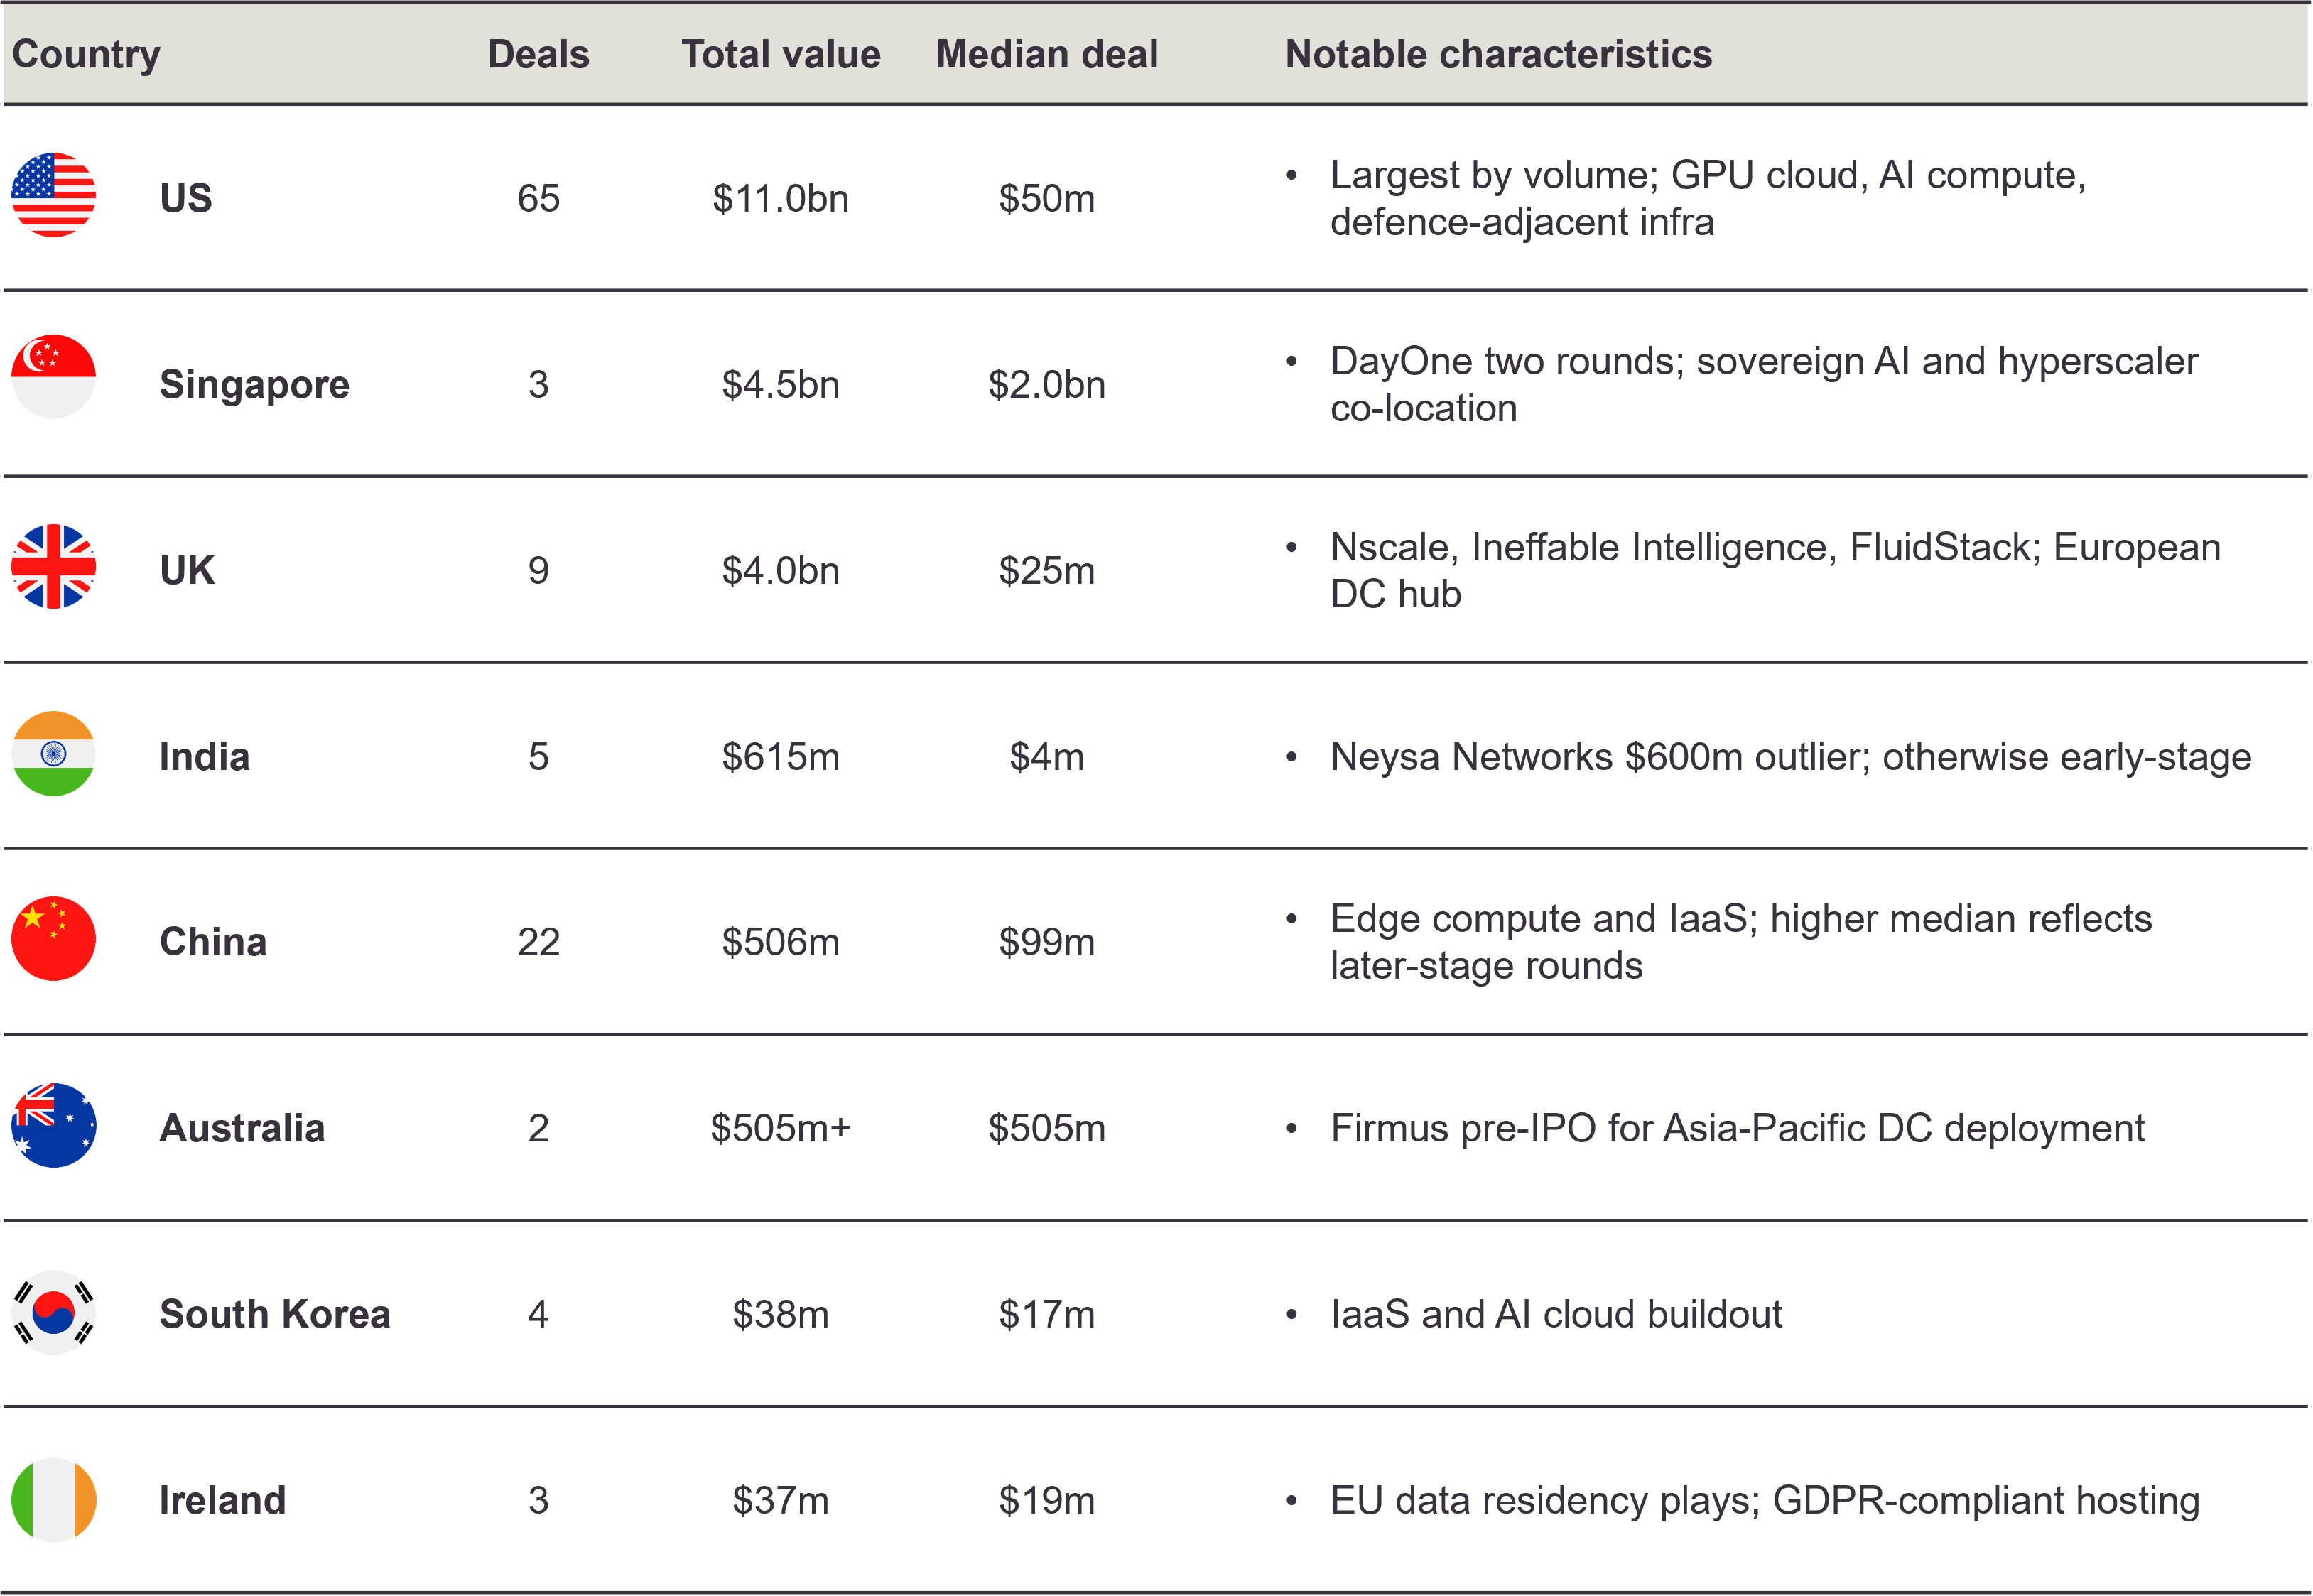
Source: Preqin, 1 January–18 June 2026. Excludes xAI Corp ($250bn merger). Data centre or compute infrastructure categories were identified by description keyword matching.
A parallel development is the rise of sovereign AI infrastructure, national Graphics Processing Units (GPU) cloud facilities that keep sensitive data and models within national borders. SoftBank is converting a former Sharp LCD plant in Osaka into a 150MW AI-only facility in partnership with OpenAI76; Swisscom and Telenor launched NVIDIA-powered AI factories77; and G42 aims to continue its five GW campus in Abu Dhabi, despite the Iran war78. These sovereign workloads introduce complexity around data residency, security clearance and multi-jurisdictional regulatory compliance that sits outside traditional infrastructure underwriting frameworks. Industry experts point to structural pressures building on the supply side. Grid connections are scarce, European energy costs remain four to five times pre-war levels, and hyperscaler demand has extended typical PPA durations from 10 to 12 years to 20 years, reshaping the risk-return profile of energy assets tied to data centre load79. Indeed, alongside growing demands on grid capacity, there is the potential intensification of downstream environmental costs, given the overlapping need to house, power and cool data centres80.
Private Finance Initiative: sector to watch
The Private Finance Initiative (PFI) is a UK procurement model introduced in 1992 under which private sector consortia finance, design, build, operate, and service public infrastructure under long-term contracts, typically 25 to 30 years, in exchange for availability-based unitary charge payments from the public authority81. Assets delivered under PFI span hospitals, schools, prisons, roads, military accommodation and waste management facilities. At its peak, PFIs produced over 700 contracts with a combined capital value of approximately £57bn82. The model was retired for new contracts in 2018 amid concerns about fiscal risk and inflexibility, though the government still makes payments of nearly £10bn per year on the existing portfolio83.
However, the PFI model has regained prominence in recent years. In June 2025, NHS England Chief Executive Jim Mackey signalled a new off-balance-sheet capital mechanism to address the NHS estate’s maintenance backlog84, now exceeding £16bn85. This points to selective re-engagement rather than a wholesale revival, with the UK government seeking private capital discipline in specific asset classes where public budgets may struggle without support.
The more immediate opportunity lies in the existing portfolio. Of the 550 current PFI contracts, 78 are due to expire by December 2027 and a further 91 between 2028 and 203086.
There is an active secondary market for PFI equity, with the 10 largest private investors owning more than 50% of all contracts87. Contract expiry is generating advisory, refinancing and asset management opportunities as parties navigate handback conditions and transition to alternative delivery models. Around 25% of public authority survey respondents reported lacking the in-house skills to manage expiry, with 60% planning to hire consultants, a direct opening for private sector participants with sector expertise88. For investors already active in PFI secondary markets, the contract expiry wave presents an opportunity to acquire equity positions from those who may be looking to exit ahead of potential handback challenges, and provide advisory and refinancing support to public authorities that may lack in-house capacity.
Footnotes
[9]Federal Surplus or Deficit [-] as Percent of Gross Domestic Product (FYFSGDA188S) | FRED | St. Louis Fed
[12] OECD Economic Outlook, Volume 2026 Issue 1 (EN)
The budget deficit: a short guide - House of Commons Library
[14]Volume of retail trade down by 0.4% in the euro area and by 0.5% in the EU - Euro indicators - Eurostat
[15]Volume of retail trade up by 0.2% in the euro area and by 0.5% in the EU - Euro indicators - Eurostat
[53]Investment Banking Scorecard: Comprehensive M&A and Capital Markets Data | The Wall Street Journal
[54]Investment Banking Scorecard: Comprehensive M&A and Capital Markets Data | The Wall Street Journal
[63] PEI Infrastructure Investor Global Summit, Berlin, March 2026.
[64] Macfarlanes analysis of Preqin AI Deals Database, 19 June 2026.
[65] Ibid, 2026.
[66] PEI Infrastructure Investor Global Summit, Berlin, March 2026; panel on AI infrastructure and bubble risk.
[67] Macfarlanes analysis of Preqin AI Deals Database, 19 June 2026; PEI Infrastructure Investor Global Summit, Berlin, March 2026.
[68] SuperReturn Europe Conference, Amsterdam, November 2025.
[69] Private Equity Europe Forum, London, September 2025; BVCA Summit, London, September 2025
[70] CapLink European Private Capital Summit, London, February 2026; Accordion survey data.
[71] Real Deals PE Live Conference, London, May 2026; AI panel.
[72] A Single AI Data Centre Now Uses More Electricity Than 100,000 Homes. The Grid Wasn’t Built for This. | by Kolabs | Jun, 2026 | Medium
[73] McKinsey & Company, “The Infrastructure Moment,” September 2025.
[74] Macfarlanes analysis of Preqin Datacentre deals database, 19 June 2026. Excludes xAI Corp ($250bn merger).
[75] Sakamoto, Kanoko, Sharp to sell part of Osaka LCD factory site to Softbank for $636m, Nikkei Asia, May 2025.
[76] Europe builds AI infrastructure with NVIDIA to fuel region’s next industrial transformation | IoT Now News & Reports
[78] PEI Infrastructure Investor Global Summit, Berlin, March 2026; panel on AI, data centres and digital infrastructure.
[80] Thomson Reuters Practical Law, Private finance initiative (PFI).
[82] Ibid, 2026.
Authors



Related topics
Like what you are reading?
Stay up to date with our latest insights, events and updates – direct to your inbox.
How can we help you?
Browse our people by name, team or area of focus to find the expert that you need.